By Dr. Fred Ward Op Ed in the Machester Union Leader
In the New Hampshire Union Leader this past summer, I exchanged some opinions on global warming with Dr. Cameron Wake of the University of New Hampshire. With this long, cold winter winding down, it is time to revisit the discussion. The debate started with Wake calculating that the winter temperatures in New England had warmed by 1 1/2 degrees per decade for the last three decades of the last century, or more than 4 degrees! He concluded that this extreme warming was likely due to increased carbon dioxide (CO2) emissions caused by man’s activities.
Moreover, he warned that if we continued to pump CO2 into the air, we would likely see this warming of 1 1/2 degrees per decade continue into the present century. He also made some dire predictions of the effect of this continued warming on all manner of biological plants and animals, right down to the final New England skier. We have just finished the ninth of the 10 winters of the first decade of this century, an appropriate time to look at the latest data. Did the rise of 1 1/2 degrees per decade (1 1/3 degrees for these nine winters) continue with its attendant catastrophic consequences?
The data for the first five years of the new millennium, 1999-00 to 2003-04, yield an average winter temperature of 24.6 degrees, and a temperature for the most recent four winters of 25.9. But if Wake’s expected warming continued (1 1/3 degrees for 9/10th of another decade), we should have found a temperature for the 2004-05 to 2007-08 winters of between 28 and 29 degrees. Not only did the winter temperature not rise to 28.4 degrees, as Wake projected, it actually fell one to two degrees toward the levels we’ve been seeing all our lives. This reversal from warming to cooling occurred despite continuing increases in man-made carbon-dioxide emissions. Wake’s pessimistic forecast of catastrophic increases in temperature have simply not comported with reality.
Wake also pointed out that there was a decrease in the winter snowfall in New England in recent times, implying a trend likely to continue. So where did all this snow come from? Read more and comments here. Note: Concord, New Hampshire had a record snowy December to February period and for the entire season is second only to 1873/74. Also St Johnsbury, Vermont yesterday set a new record for seasonal snow when they reached 139.1 inches, breaking the prior record set in 1968/69. Records there extend back to 1894.
Fred Ward of Stoddard has a Ph.D. in meteorology from Massachusetts Institute of Technology and was a meteorologist on Channel 7 in Boston in the 1960s and 1970s.
By Anthony Watts, Watts Up With That
The RSS Microwave Sounder Unit (MSU) global temperature anomaly data has been published this morning by RSS (Remote Sensing Systems of Santa Rosa, CA). For March 2008 it has moved a little higher, with a value of .079C for a change of 0.081C globally from February. January 2008 was -0.07, February -0.002.
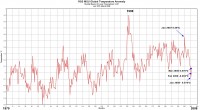
See larger graph here
The interesting news is the divergence between northern and southern hemispheres, and the plunge seen in the continental USA. I’ll have more on that coming up. On a related note: Lucia over at The Blackboard just posted a very well done analysis that takes ENSO into account in falsifying the IPCC AR4 projection of +2.0C/century. Here is her graph showing IPCC AR4 projections compared with observations and best fit trend:
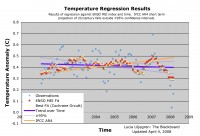
See larger graph here
By Anthony Watts, Watts Up With That
Our newest volunteer at surfacestations.org is Keith Taylor, and he’s gotten of to a great start with 2 stations in 2 days. Hi first was the climate station of record for Williamsburg, KY, USHCN station #158709 (or maybe 158711). Like many USHCN stations, it is located at a sewage treatment plant. I’ve previously mentioned several times how the MMTS electronic thermometer has caused stations converted from traditional mercury max-min thermometers to MMTS get closer to building because of cable laying issues. This one is a little closer than usual.
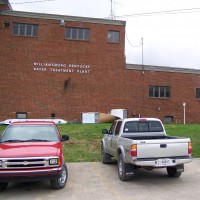
Keith reports the sensor head is only 33 inches from the brick building wall. And, just off in the background, a new electric power transformer is being installed. In fact it looks like a lot of land use changes are going on around the station due to construction. From the home page of this wastewater treatment plant, we learn that: The Williamsburg Waste Water Treatment Plant underwent a state-of-the-art expansion in 2003. Today the plant is rated at 2 million gallons with a peak production of six million gallons per day. Thats a lot of waste water (and waster heat) going through. It will be interesting to see what effects those construction and capacity changes may have to the temperature record in the years ahead. Like many stations we’ve found, there is convenient parking available as well.
You can see the complete gallery of photos here. See full post here.
By Joseph D’Aleo, CCM
Although it is a week away, there are continuing signs we may be in for a typical early spring La Nina storm event that will threaten more flooding rains, at least one major tornado outbreak day and a major blizzard on the northwest side. Flooding in La Nina years averages nearly $4.5 billion compared to an average of $2.4 billion. We have already seen examples of that this year in Missouri and Arkansas.
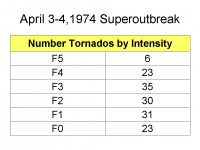
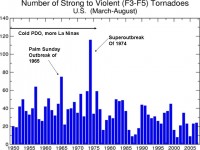
Major tornado outbreaks occurred in January 1999, a recent La Nina year, in Arkansas and Tennessee and in May in Oklahoma and Kansas with $2.3 billion in damages. And of course the super tornado outbreak of April 1974 with its 148 tornadoes that left 315 dead and 500 injured occurred during a very strong La Nina. In a prior La Nina event in 1965, the so-called Palm Sunday Outbreak had 78 tornadoes, 271 deaths and 1500 injuries.
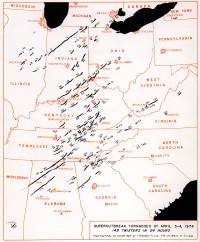
See huge image here
There were many F3-F5 storms in that 1974 Superoutbreak event (64).
See larger image here
There were 38 F3-F5 tornadoes in 1965, the second most active day on record. See how the frequency of F3-F5 torndoes dropped off after the Great Pacific Climate Shift in 1977. In the cool Pacific PDO mode that preceded it, more La Ninas were favored and occurred and they frequently lead to more tornado outbreaks in the winter and spring along with more northern and western winter snows and spring flooding. We have already seen each of these occur in recent months.
See full size image here
We can only hope that it doesn’t come together and is not a major damaging event. If it does, with no sense of history, expect the media and friends to blame it on man-made global climate change.
By John McLean
On 25 March the US National Snow and Ice Data Center (NSIDC) and the British Antarctic Survey (BAS) jointly published a press statement declaring that the Wilkins Ice Shelf “has begun to collapse because of rapid climate change in a fast-warming region of Antarctica.” I’ve looked at relevant public data and I’m undecided whether this statement was a gross exaggeration, an inept interpretation of the evidence or borderline fraud, because I can see nothing about the collapse to indicate that it was anything but a natural event.
Firstly, there were no other reports of recent collapses in this part of the Antarctic during what the end of the (southern) summer melt period. If climate was the major cause then surely we would have seen other instances of ice shelf disintegration, shelves such as the nearby King George IV shelf or the several shelves along the Bellinghausen Sea just 500km to the west. Secondly and more importantly, there is nothing in the observational data to suggest a dramatic recent change in climatic conditions. The NSIDC/BAS press statement, grandly titled “Antarctic Ice Shelf Disintegration Underscores a Warming World”, said “In the past 50 years, the western Antarctic Peninsula has experienced the biggest temperature increase on Earth, rising by 0.5 degree Celsius (0.9 degree Fahrenheit) per decade.” By accident or design that press release omitted some very vital details about that increase, details that show the warming to have very minor effect and that the likely cause of recent temperature change is quite natural.
The Wilkins Ice Shelf is located about half way along the western (i.e. Pacific) side of the Antarctic Peninsula, that tongue of land stretching towards South America and reaching latitudes comparable with central Alaska (or for European readers, the Finnish city of Oulu). The NSIDC photographs of the Wilkins Ice Shelf give a clear indication of the normal cycle of events and show a lot about the collapse. The distinct line indicates the natural boundary of thicker pack ice and thinner sea ice. The area indicated as being reformed appears to be part of an old collapse that sea ice has progressively filled. The ice in this region is rougher than the long-term pack ice.
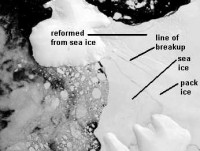
Image is for January 15, 2008, prior to the partial break-up. See larger image here
A plausible hypothesis is that wind and wave conditions during the second quarter of 2007 caused internal forces that opened an old weakness in the ice. Perhaps that weakness was caused by undercutting wave action back in 2004 and the sea ice has until now had braced the pack ice. The hypothesis of previous bracing is supported by the press statement, which said “Satellite images indicate that the Wilkins began its collapse on February 28; data revealed that a large iceberg, 41 by 2.5 kilometers (25.5 by 1.5 miles), fell away from the ice shelf’s southwestern front, triggering a runaway disintegration of 405 square kilometers (160 square miles) of the shelf interior”. One collapse apparently triggered another, which is what we’d expect from bracing. This begs the question of when the Wilkins Ice Shelf last lost ice from its southwestern edge and whether the recent collapse was not some kind of “catch up” of natural processes.
There are many possible causes for this loss of ice, which in itself is hardly a momentous and unknown event, but it seems that neither NSIDC nor BAS were inclined to look beyond the reasons that we all recognize as being likely to interest the news media. If NSIDC or BAS have evidence that the ice shelf collapsed due to man-made warming then they need to produce it very quickly. Until that happens I will continue to believe that their great hype about man-made climate change is no more than a con job. It grabbed some brief media attention but now we can go back to observing falling temperatures and a very poor correlation between temperature and carbon dioxide concentration, two factors that unfortunately for many believers threaten to undermine the claims of man-made warming. See full pdf analysis here.
Steamboat Posts Record Breaking Champagne Powder Snow SeasonSteamboat Springs Press Release
With more than 37 feet of Champagne Powder snow this winter, the Steamboat Ski Resort will finish the 2007/2008 season in record fashion, breaking its previous season snow record of 447.75 inches set in 1996/1997. “Despite early forecasts calling for a warmer and drier winter, big snows, often the norm in Steamboat, were a common occurrence and provided a season full of epic powder days,” said Chris Diamond, president & chief operating officer for Steamboat Ski & Resort Corporation. “Powderhounds will have plenty of powder tales to tell for years or at the very least until the cycle begins again with the opening of the 2008/2009 season on November 26th.”
Overnight, a storm blanketed the resort with 4 inches at mid-mountain and the summit resulting in a 74-inch base at mid-mountain and 97-inch base at the summit, moving the season snowfall total to 450 inches, 2.25 inches more than the previous record-breaking season. Currently, the top-three season snow totals for Steamboat include this year’s 450 (& counting); 447.75 in 1996/97; and 447.5 in 1983/84.
In addition to establishing a new all-time snowfall record and registering a “four-wire winter”, the resort hit three key milestones within just a month of each other: surpassing 300-inch mark on 2/1/08; six days later surpassing 350-inch mark on 2/7/08; and on March 2nd surpassing the 400-inch mark. Furthermore, Steamboat-Ski Town, U.S.A. received more than 100 inches of snow for three months (December, January & February) for the first time in resort history.
Since November 21st, snow has fallen 91 out of 122 days (74.5%) with 51 of those days recording four or more inches. This season at mid-mountain, the resort has seen 17 inches in October; 23 inches in November; 126 inches in December (3rd snowiest); 129 inches in January (2nd snowiest) and 104 inches in February (2nd snowiest); and 51 inches in March for a combined total of 450 inches (37.5 feet).
By Basil Copeland and Anthony Watts, Watts Up With That
In Part I, we presented evidence of a noticable periodicity in globally averaged temperatures when filtered with Hodrick-Prescott smoothing. Using a default value of lamda of 100, we saw a bidecadal pattern in the rate of change in the smoothed temperature series that appears closely related to 22 year Hale solar cycles. There was also evidence of a longer climate cycle of ~66 years, or three Hale solar cycles, corresponding to slightly higher peaks of cycles 11 to 17 and 17 to 23. For the layman reader, this is much like a tunable bandpass filter used in radio communications, where lambda is the tuning knob used to determine the what band of frequencies are passed and which are excluded.
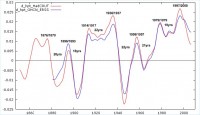
See larger image here
In part 2, a smaller lambda was used. A lower value of lambda would result in much less smoothing. To test the sensitivity of the findings reported in Part I, we refiltered with a lambda of 7.
And when we look at the first differences of the less smoothed trend line, they too are no longer as smooth as in tghe graph above from Part I. Nevertheless, the correlation to the 22 year Hale cycle peaks is still there, and we can now see the 11 year Schwabe cycle as well.
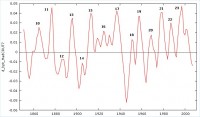
See larger image here
The pattern shown, while not as eye-catching, perhaps, as the pattern in first figure is still quite revealing. There is a notable tendency for amplitude of the peak rate of change to alternate between even and odd numbered solar cycles, being higher with the odd numbered solar cycles, and lower in even numbered cycles. This is consistent with a known feature of the Hale cycle in which the 22 year cycle is composed of alternating 11 year phases, referred to as parallel and antiparallel phases, with transitions occurring near solar peaks.
Even cycles lead to an open heliosphere where GCR reaches the earth more easily. Mavromichalaki, et. al. (1997), and Orgutsov, et al. (2003) contend that during solar cycles with positive polarity, the GCR flux is doubled. This strongly implicates Galactic Cosmic Ray (GCR) flux in modulating global temperature trends. The lower peak amplitudes for even solar cycles and the higher peak amplitudes for odd solar cycles shown in bottom figure appears to directly confirm the kind of influence on terrestrial climate postulated by Svensmark in Influence of Cosmic Rays on Earth’s Climate (1998). From the pattern indicated, the implication is that the “warming” of the late 20th century was not so much warming as it was less cooling than in each preceding solar cycle, perhaps relating to the rise in geomagnetic activity.
Read more of this important new two part series Part I and Part 2.
By Joseph D’Aleo
Back in November, I posted this blog showing some evidence that a lack of volcanic ash may have contributed to the recent warmth especially in the polar regions. The temperature anomalies were shown in this pair of maps for high and low aerosol content.
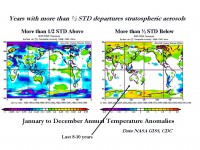
See larger image here.
Annual Temperatures when Stratospheric Aerosol content is high as after a major volcano(s) (left) and low (right). Composites are for years where standardized globally averaged aerosol levels exceed 1/2 STD above or below long term average
Eugenio Hackbart of the Brazil Metsul called our attention to a new story in New Scientist Environment by David Shiga that provides support for that hypothesis. He notes:
Last month’s lunar eclipse not only treated skygazers to a ruddy view of the Moon - it revealed that Earth’s atmosphere contains little light-blocking volcanic dust. Some researchers say the low volcanic dust levels in the atmosphere over the last dozen years could be contributing to global warming, but others dispute the claim. During a lunar eclipse, Earth blocks sunlight from reaching the Moon directly. But some sunlight still gets through, refracted through Earth’s atmosphere. The amount varies, depending mainly on how much dust from volcanic eruptions is floating around at high altitudes. Because dust can block sunlight from passing through the atmosphere, more dust makes for a darker Moon during lunar eclipses. “All the big dimmings of the Moon during eclipses can be attributed to specific volcanoes,” says Richard Keen of the University of Colorado in Boulder, US.
Keen and his collaborators have charted the brightness of eclipses back to 1960 and for a few years around the time of the 1883 eruption of Indonesia’s Krakatoa volcano. The most recent lunar eclipse, on 20-21 February, was a bright one, measuring a 3 - the second-brightest level - on an eclipse-rating scale that ranges from 0 to 4. That is in line with eclipse data taken since 1995. In that time, the stratosphere has been especially clear, with very little haze-producing volcanic activity compared to the previous three decades, from 1965 to 1995, Keen says. Because more sunlight is reaching the surface, Earth should be 0.1 to 0.2° Celsius warmer in recent years than it was back in the late 1960s, Keen and his colleagues calculate.
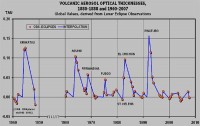
See larger image here.
Susan Solomon of the US National Oceanic and Atmospheric Administration in Boulder, Colorado disputes Keen’s conclusions. The amount of haze in the stratosphere has been higher - blocking more sunlight - in the past 40 years compared to the 20 years before that, she says. So over the past 60 years, there would have been a slight cooling trend if volcanic haze were the only influence on climate, she says.
Keen acknowledges that depending on the period chosen, volcanic haze can give a cooling rather than a warming trend. But he argues that the relatively long period with a clear atmosphere since 1995 could be having a big impact on climate, especially if the extra sunshine reaching the Earth’s surface could create subtle, longer-term warming effects through the heating of ocean water, as some scientists propose.
Icecap Note: Solomon has been wrong before. She was a lead author of the latest IPCC Summary for Policymakers that greatly overstated the human greenhouse influence on climate. She was a leader in the ozone hole consensus a few decades back that may have collapsed. She is wrong again here. Keen was talking about the period since 1995 in which the volcanic aerosols have been as rock bottom levels not the last 60 years.
By Gary Rayno, Union Leader
Yesterday’s snow in Concord was just enough to slide this winter into second place on the all-time snowfall list for New Hampshire since records have been kept, 115.2 inches, leaving us 6.8 inches short of the record of 122 inches, set in 1873-74. See in this story the listing of the top 10 snowiest winters, most all in the 1800s.
By Matt Sutkoski, Burlington Free Press
Count northern Vermont’s sugar maples among those wallowing in the winter blahs. Sugaring season across the state is dawdling, because continuous cold temperatures are keeping the sap from flowing out of maple trees and into the evaporators Vermont’s sugar makers use to create syrup. Friday through Sunday is Vermont Maple Open House Weekend, when the public is invited to visit sugarhouses to see how syrup is made and sample the products. Despite the cold, there will be enough syrup to go around. Still, farmers wish the sap flow from maples would pick up the pace.
“It’s just barely dripping, if that. It’s off to a very slow start in our bush,” said Virginia Fleury of Fleury’s Maple Hill Farm in Berkshire. Like most syrup producers, Fleury is far from ready to write off the season. “We can make quite a bit in April if the weather comes off right. The problem is, in past years it warmed up rather quickly. The minute it hits 60 or 65 degrees, you might as well forget it,” she said. Read full story here.
Icecap Note: Just last summer environmentalists and alarmist professors from the region met at Mount Washington to predict the north country would be facing major economic impacts due to lack of snow affecting the winter sports industry and global warming leading to the demise of the maple trees that are at the heart of Vermont’s famous maple syrup industry and fall foliage tourism. So what happens, Burlington and the mountains have a record winter snowfall (December through February) and many areas are pushing all time seasonal snow records. Maple trees will not need a passport to move to Canada as the cyclical changes in the Pacific and the quiet sun ensure we return to the climate of the 1960s and maybe worse.
By Richard Harris, NPR
Some 3,000 scientific robots that are plying the ocean have sent home a puzzling message. These diving instruments suggest that the oceans have not warmed up at all over the past four or five years. That could mean global warming has taken a breather. Or it could mean scientists aren’t quite understanding what their robots are telling them.
This is puzzling in part because here on the surface of the Earth, the years since 2003 have been some of the hottest on record. But Josh Willis at NASA’s Jet Propulsion Laboratory says the oceans are what really matter when it comes to global warming. In fact, 80 percent to 90 percent of global warming involves heating up ocean waters. They hold much more heat than the atmosphere can. So Willis has been studying the ocean with a fleet of robotic instruments called the Argo system. The buoys can dive 3,000 feet down and measure ocean temperature. Since the system was fully deployed in 2003, it has recorded no warming of the global oceans.
Read the full story here
Icecap Note: If anyone would bother to look at the actual data instead of just pronouncements in the media from NOAA or GISS, they would not be surprised at all by these findings. Here is a plot of actual monthly temperatures and the trends from the Hadley global data set (HADCRUT3v) and University of Alabama satellite derived lower tropospheric temperatures covering the same period as the robots measured ocean heat content. Like the robots they show a downtrend (cooling).
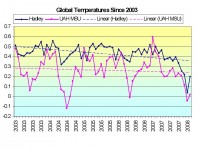
See full size graph here
It is also worth noting that Roger Pielke Sr. has advocated ocean heat content as a better measure of the global changes in temperatures than surface station based trends. Work by Roger and Anthony Watts at surfacestations.org have identified major issues with the land stations. In this case the ocean heat content agrees with the land stations, so the cooling over the past 5 years is very likely real. 5 years does not a long term trend make but it does call into question claims the warming is accelerating and that immediate action is required. Indeed Roger has just posted on this on Climate Science. See his post here. He has also reposted this story ”Big Time Gambling With Multi-Decadal Global Climate Model Predictions” by Roger A. Pielke Sr. and Roger A. Pielke Jr.
By Joseph D’Aleo, CCM
This is the latest decadal plot from February 1998 to February 2008 of global temperatures from Satellite (UAH MSU lower troposphere) (blue) and land and ocean variance adjusted surface (Hadley CRU T3v) (rose) plotted with Scripps monthly CO2 from Mauna Loa (green).
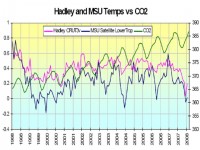
See larger graph here.
The decadal correlation strengths (r-squared) of both the Hadley and MSU satellite with the corresponding CO2 is non-existent (r2=0.00). If you start in 2000 at the coldest point of the last decade, this does not significantly change (r2=0.01 for the Hadley and r2=0.08 for MSU). These numbers also do not change if you use the Scripps seasonally adjusted CO2 values (r2=0.00 for both the decadal Hadley and MSU). The correlation since 2000 stays at r2=0.01 for the Hadley but drops to r2=0.05 for the MSU using this seasonally adjusted CO2.
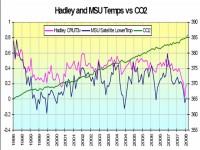
See larger graph here.
The challenge of course will be that a decade (or 7 years) is not a fair test, longer term monitoring is required to determine real trends. My response is that we are being told by Al Gore and James Hansen that the problem is worse than the IPCC and the scientists feared. That we are rapidly nearing the tipping point and that unless we take painful action immediately, temperatures will run away from us. If that was the case we should see some correlation even in the short term. It doesn’t take an advanced science degree to see there has been virtually no trend in the temperature data in the last decade or this century even as CO2 has increased 5.5%. Even the IPCC head Dr. Rajendra Pachauri has noticed the disconnect and acknowledged we have to look and see if natural forces were somehow countering greenhouse warming.
See in the attached pdf though how the temperatures do correspond far better with the ENSO cycles and longer term with PDO which controls the relative frequency of El Nino and La Nina. With an apparent shift on the regime of the PDO to cool and the prospects of solar cycles 24 and 25 being quiet, global cooling is more likely than global warming in the decades ahead.
See here in this Energy and Environment paper how this so called correlation comes and goes with the natural cycles.
By Joseph D’Aleo, CCM
In an important paper in 1991, Friis-Christensen et.al. compared the average temperature in the northern hemisphere with the average solar activity defined through the interval between successive sunspot maxima. The more active the sun - the shorter the interval: the solar cycle runs more intense and the higher the global temperatures. Even the finer structures in the two curves had similar appearances.
The long standing observation site at Armagh in Northern Ireland shows similar results. Again you can see shorter cycles are warmer and longer colder.
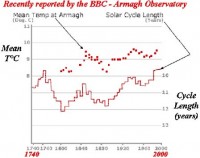
See this paper on cycles seen in the Armagh data set here
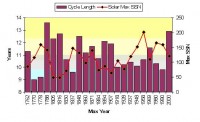
In general the longer cycles are also associated with diminished sunspot activity. I have plotted solar cycle length (columns and sunspot numbers since sunspot cycles were first numbered back in the middle 1700s.
See larger size graph here
The Armagh plot goes back to cycle 4, Friis Christensen around cycle 10. You can see the long cycles around the cold Dalton Minimum in the early 1800s and again in the cold late 1800s to early 1900s. The decreasing length and increasing SSNs accompanied a rise in temperatures in the first half of the 1900s and again late in the century. Note the longer cycle 20 with a dip in sunspot numbers that accompanied the cooling in the 1960s into the 1970s. The current cycle (23 which peaked in 2000) length is still TBD but is likely to be at least close to 12 years. This would imply the cooling that appears to have started in 1998/99 or 2001/02 depending in data set used is real and will continue/accelerate.
Read more here Also note Anthony Watts has posted several solar stories over at his blog with some very intersting comments and he has posted a new story there now with Basil Copeland entitled Evidence of a Significant Solar Imprint in Annual Globally Averaged Temperature Trends - Part 1 in which by proper filtering extratcs the 22 year Hale solar Cycle in the temperature data.
By Roger Pielke Jr., Prometheus
Regular readers will recall that not long ago I asked the climate community research community to suggest what climate observations might be observed on decadal time scales that might be inconsistent with predictions from models. While Real Climate has decided to take a pass on this question other scientists and interested observers have taken up the challenge, no doubt with interest added by the recent cooling in the primary datasets of global temperature.
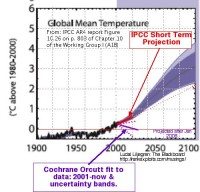
A very interesting perspective is provided by Lucia Liljegren, who has several interesting posts on observations versus predictions. The figure below is from her analysis. Her complete analysis can be found here.
See larger image here
She writes “No matter which major temperature measuring group we examine, or which reasonable criteria for limiting our choices we select, it appears that possible that something not anticipated by the IPCC WG1 happened soon after they published their predictions for this century. That something may be the shift in the Pacific Decadal Oscillation; it may be something else. Statistics cannot tell us. “ Read more of Roger’s post and comments here.
By Anthony Watts, Watts Up With That
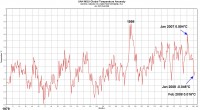
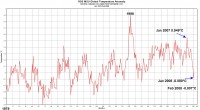
Last week I posted the University of Alabama, Huntsville (UAH) Microwave Sounder Unit (MSU) global temperature anomaly data for February 2008 with a note that it showed only a marginal increase from January 2008 data, and remained near zero. The February 2008 global temperature anomaly data from RSS (Remote Sensing Systems of Santa Rosa, CA) is out, and is in good agreement with that. You can see it the raw RSS data yourself here.
First here is UAH satellite derived temperature anomaly. For February 2008, it shows a slight rebound from the -0.046C value of January 2008 to 0.016C for a slight change of .062C upwards.
See larger graph here
Next we have the RSS satellite derived temperature anomaly. It also shows a slight rebound from the -0.080C value of January 2008 to 0.007C for a slight change of .0.073C upwards. The anomaly remains near zero as does the UAH data.
See larger graph here
See some of the possible reasons why in Anthony’s post and also see a post with a note and graph from Dr. Richard Lindzen here.
By Christopher C. Horner
500 people who pay attention to such things are gathered in New York City, from where I write, hoping to share experiences, research, and insights. These include scientists of the “hard” variety (geologists, climatologists, etc) and the soft (economists, statisticians). Global warming alarmists insist that anyone who isn’t a climatologist, or at least pop star, isn’t qualified to speak to the issue, when they disagree, that is, although this also happens to represent the makeup of the vaunted UN panel of “two thousand of the world’s leading scientists” most of whom, by the alarmists’ own standards, are no such thing.
In short, this is a serious gathering, if largely light-hearted, attended by participants including media from all over the civilized world, as well as several parts of Europe. Czech President Vaclav Klaus is in da house, warning the crowd to pay attention to arguments of humanitarian salvation which his experience, and Mencken’s adages, suggest are always a false front for the urge to rule.
Meanwhile, in the unnerving buildup to this outrage of a gathering, last week the alarmists started insisting that, by insisting a “consensus” exists, they never meant “consensus;” and alarmist professor John Holdren now ways that they never really meant “global warming” (or, presumably, the “global cooling” before that), but “global climate disruption.” Just rolls off the tongue.
No, this afternoon I spoke to the issue of the media’s hilarious contortions in the name of the global warming agenda. You read or hear it daily. A single year or weather event is newsworthy and meaningful, unless it’s the wrong kind. Individual research papers warrant coverage, and what coverage! when their results are alarmist. Otherwise, they’re just one paper! We have learned that three years is a pattern, unless it is on the cooling side of the ledger. We know that ten years is conclusive, unless you mean the past ten years of no warming. Unseasonably warm weather is clear evidence of global warming, exceptional cold is merely an anomaly. Warming temperatures, over whatever period the press chooses to muster, as well as retreating glaciers are sure signs of “global warming.” Cooling temperatures and advancing glaciers are signs of nothing.
This is progress, of course. Reality is increasingly forcing our media and other alarmist friends out of their comfort zones. As a graduate of Al Gore’s climate camp recently howled in protest during a debate with me at Michigan State, “no matter how many charts he shows you, it’s warming!” Of course it is, dear. Read more here.
Mr. Horner is author of ”The Politically Incorrect Guide to Global Warming and Environmentalism.”


